Radiation for Dummys – as measured aboard Artemis
Analysis of Artemis I data suggests the Van Allen and cislunar radiation is more dangerous than advertised for Artemis II
In my previous article, we established that the Polaris Dawn’s ‘daring’ journey into the innermost edge of the Van Allen proton belt was both grossly exaggerated and blown out of proportion by the media. To say nothing of being completely incomparable with radiation exposure during a flight to the Moon. As a happy coincidence, if one believes in such things, just over a week after the Polaris Dawn splashed down in September 2024, the official results concerning just such a Moon mission were released.
S.P. George et al 2024 published a paper in Nature concerning the testing of radiation on the Artemis I dummies, Helga and Zohar. Titled Space radiation measurements during the Artemis I lunar mission, the paper was released into the public domain and, exceptionally, immediately made open access and not blocked behind a paywall. 1
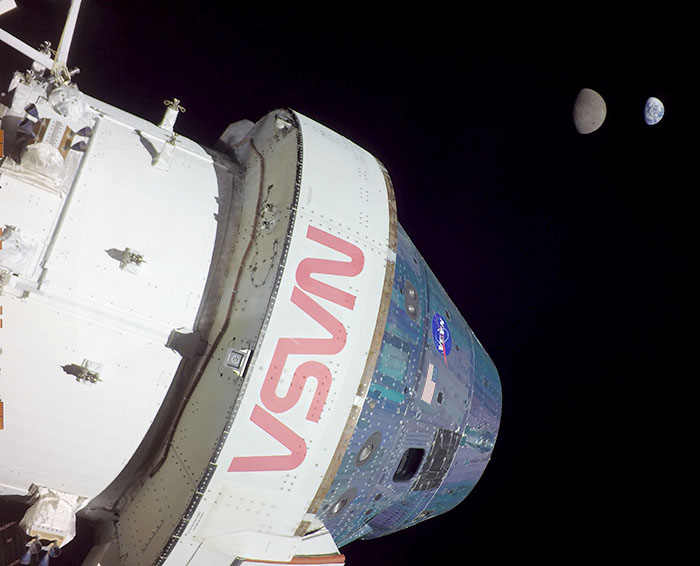
Fig 1. Artemis I looking back at the Earth and Moon from 268,563 miles away during its Lunar ‘near-rectilinear halo’ orbit. This photo was taken by a camera attached to the spacecraft’s solar panels on flight day 13, November 28, 2022, NASA.
Technically known as ATOM Phantoms, these two dummies of female torsos, complete with simulated bones and internal organs, were publicly designated as MARE Phantoms. MARE being both an abbreviation of Matroshka AstroRad Radiation Experiment and wordplay referencing the dark maria regions of the Moon (e.g. Mare Tranquillitatis, Mare Imbrium etc.). Both MARE Phantoms carried a series of radiation detectors (M-42) supplied by the German Aerospace Centre together with NASA-supplied Crew Active Dosimeters (CAD). To get an idea on the penetrability of the cislunar radiation, Zohar wore the AstroRad vest intended to protect astronauts from radiation, while Helga did not.
Two of these CADs were also carried in the pockets of the spacesuit worn by Moonikin Commander Campos. This male manikin was named in honour of Arturo Campos, the electrical power subsystem manager on the Apollo 13 mission.2 Cdr. Campos wore the Orion Crew Survival System suit – intended to be worn by Artemis astronauts during launch and re-entry and flew in seat 1. Crew seats 3 & 4 intended for the Mission Specialists were occupied by Zohar (below Cdr. Moonikin) and Helga (below the location of the pilot’s seat).
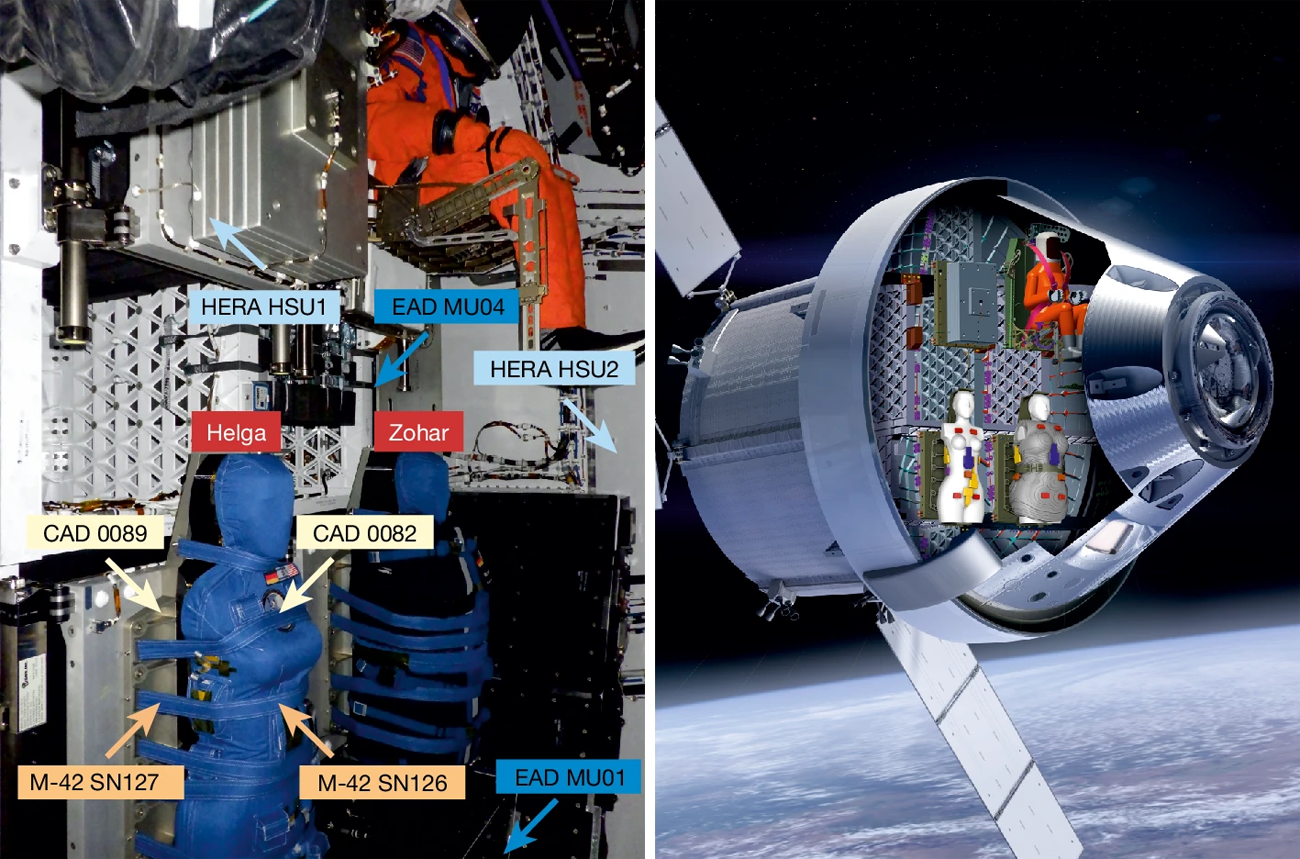
Fig 2. Left: Prelaunch image showing the location of the two female Phantoms Helga and Zohar and radiation instruments aboard Artemis I. The full body male manikin Captain Moonikin is in the commander’s seat. Right: Cutaway diagram illustrating their placement within the spacecraft. S.P. George et al. 2024. Click to enlarge
In addition, ESA supplied its own active dosimeters (EAD), which were fixed to the walls surrounding these MARE Phantoms. Finally, NASA also supplied three Hybrid Electronic Radiation Assessor (HERA) detectors, which were planted at different locations throughout the Orion spacecraft and given their own identification numbers. HSU1 was located in the central cargo bay (the storm shelter section of the craft) and placed behind the pilot’s position. Moonikin, Helga and Zohar were in the less protected crew section. HSU2 and HPU were both located in the crew cabin with the former ahead of the crew seats and the latter closer to the aft bulkhead. The results concerning these Artemis HERA detectors were published in November 2023 by N.N. Stoffle et al.3
Two months previously, Stoffle had presented an analysis of the HERA installation on the Space Station at the 26th Workshop on Radiation Monitoring on International Space Station. (WRMISS). Established in 1996, this annual three-day meeting of international space radiation specialists, while retaining its acronym, has since expanded from focusing on low-Earth orbit and now refers to its activities as the Workshop on Radiation Monitoring related to Humans Inside the Solar System. And so it was that during that WRMISS 2023 meeting held in Rome from 5-7 September, the last day was dedicated to radiation matters relative to Artemis, the Moon and Mars.
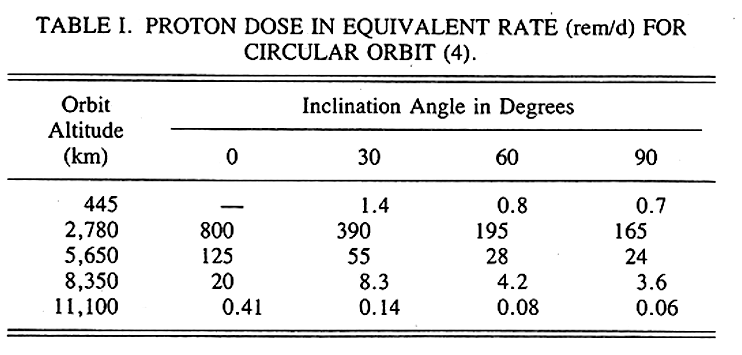
On that Thursday, Science Session 10, consisted of NASA’s Diego Laramore presenting Artemis I Radiation Analysis, Modeling, and Dose Assessment. He was followed by Edward Semones delivering SRAG Activities in Preparation for Artemis II and III. I could not find a video recording of the Laramore presentation, but his lecture slides are available for download on the WRMISS website. Interestingly, each slide is stamped in red ‘NOT FOR REDISTRIBUTION’. None of the other WRMISS lecture slides contain this stamp, so one might enquire as to whether this presentation has been placed in public view inadvertently. Was there something within his data that only a select few were intended to see? Or has it been deliberately ‘flagged’? Keeping that in mind, Diego Laramore’s presentation will be cross-referenced and examined in this article.4
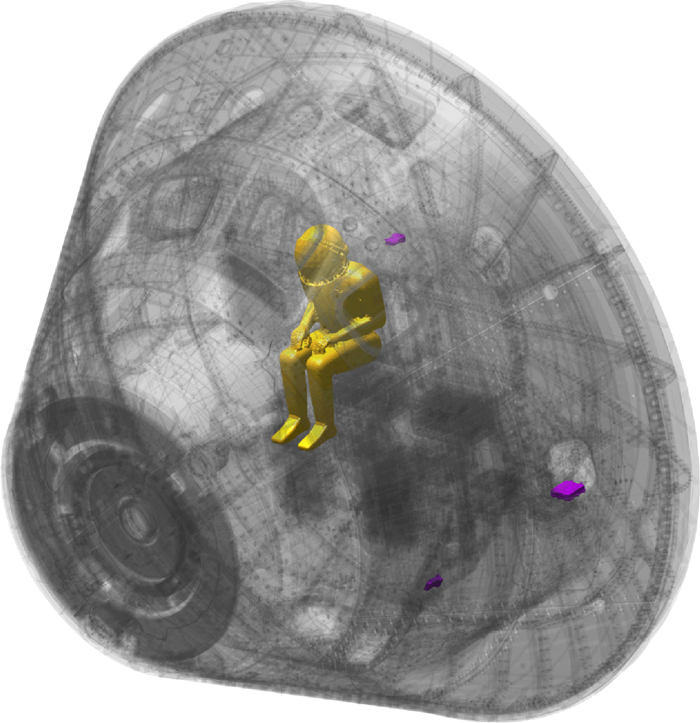
Fig 3. Locations of the three HERA detectors (purple) throughout the spacecraft: The MARE Phantoms appear as darkened shadows below a bright yellow Captain Moonikin. N.N. Stoffle et al. 2023.
Shields Up!
The problem from solar flares on translunar and interplanetary missions is typically stated as such that several meters of material are needed to bring the radiation down to safe levels. Despite this, Artemis planners, in their infinite wisdom, expect their astronauts to retreat to the central cargo bay and use it as a makeshift solar storm shelter during a major solar flare! Nonetheless, it is important to note that in addition to whatever minimal shielding would be offered by hiding in the cargo bay or wearing the AstroRad vest made of polyethylene, the Orion spacecraft itself already has nearly thrice as much shielding as the Apollo Command Module.

Fig 4. Artist's rendition of astronauts using the cargo bay as a solar storm shelter. J.E. Barzilla et al. 2024.
F.A. Cucinotta et al. (2013) reported that the Orion’s hull was equivalent to 20g/cm2 of aluminum.5 In 2005, Cucinotta was also quoted as saying that the Apollo CM, with its walls of brazed honeycomb of stainless steel and aluminum topped with epoxy resin ablative material, was rated at only 7-8g/cm2, while a spacesuit only offers 0.25g/cm2 of shielding.6 To put that into perspective, this means a spacesuit offers less protection than even a sheet of aluminum foil – an electron with 1MeV (million electron volts) of energy is readily shielding by 0.545g/cm2 of aluminum. By comparison, 8g/cm2 of aluminum will stop all electrons up to 14.68MeV.
Although the AE-8 and AE-9 models for Van Allen electrons diminish towards and stop at 7MeV, this says more about the difficulty in trying to measure high energy particles than the lack thereof. Writing about their Helium, Oxygen, Proton & Electron (HOPE) mass spectrometers carried aboard the Van Allen probes, H.O. Funsten et al. stated:
In situ measurement of this region of the Earth’s space environment presents an extraordinary challenge due to the large fluxes of penetrating radiation. In particular, substantial electron fluxes are typically observed at energies that can exceed 15MeV in both the inner radiation belt (typically centered near 1.5 RE) and outer radiation belt (typically most intense near 4–5 RE at the Earth’s magnetic equator) as well as inner belt proton energies that can exceed 100MeV.7
In 2014, I contacted H.O. Funsten, asking him to quantify the “substantial fluxes” of >15MeV electrons in both radiation belts mentioned in his paper, since they were not covered in the AE-8 or AE-9 models. My query was answered by his co-writer G.D. Reeves, who kindly provided this detailed answer:
The short answer is we don't know for sure.
Most places in the magnetosphere there are essentially no electrons with energies > 1 MeV. They just don't stick around long enough. In the inner magnetosphere they can be trapped for a long time. Trapping in the inner belt is much longer than trapping in the outer belt so the fluxes of >10 MeV electrons tend to be higher and more steady in the inner belt. How high? How steady? I'm not sure.
Here's why.
1) You need a really large detector to measure >15 MeV electrons. Large means heavy so we typically don't fly detectors that massive. The measurements we do have are typically inferred from backgrounds in detectors that are intended for other purposes and for which the electron response sensitivity isn't well known.
2) Integral measurements like Van Allen's Geiger tubes can tell you the total counting rate of electrons that trigger a response in the detector but the sensitivity as a function of energy is not well known. It's an integral measurement but at some point the sensitivity falls off. For instance when an electron passes all the way through a detector it will only deposit part of it's energy.
3) Bremsstrahlung. Any material around the detector will produce x-rays when hit by very energetic electrons. Those x-rays will often also be measured by the detector. But now the collecting area you assume isn't the entrance to the detector it's the whole spacecraft.
It is for all of these reasons that AE-8 only goes up to 7 MeV. You will have to either extrapolate the spectrum and integrate it numerically or you will have to dig into the original literature and look into both the measurements and the caveats.
I'm sorry I can't just give you "the answer". For the purposes of our study (designing a detector that properly measures <50 keV electrons and ions in a region where >15 MeV electrons are present) it was sufficient to know that they can be a problem. We didn't need to know the exact fluxes.
The Van Allen Probes satellites have an instrument called REPT that may provide the measurements we need but it's still going to take a lot of work to extract the correct values given the problems I outlined above.
Cheers
Geoff”8
Such >15MeV electrons are especially prevalent during ejection events: enormous solar flares that over-replenish the Van Allen belts with huge amounts of high energy particles. Potentially creating a temporary third belt or flooding the gap between the two creating one huge belt, >15MeV electrons can penetrate the Apollo spacecraft hull. But stopping such electrons is only half of the challenge. When electrons are stopped in shielding, they lose energy in the form of bremsstrahlung, the fraction of energy given up as secondary x-rays. Their attenuation requires an inner layer of high-Z material like lead or gold.
As for protons, there has been some great dispute and embellishments from the pro-NASA side as to just what level of shielding NASA’s lunar spacecraft offer astronauts on a mission. Attempting to calculate the Apollo 11 Van Allen dose, Robert Braeunig in his now deleted webpage, claimed that any proton carrying up to 100MeV (million electron volts) of energy would be stopped in the Apollo spacecraft, while any proton >100MeV would pass clean through the astronauts and deposit little energy.
I established both claims to be false in my MoonFaker: Radiation Reloaded video.9 The latter claim is at odds with proton therapy and proton tomography, in which protons are accelerated between 200-250MeV and do not penetrate further than the internal tumor they are targeting.10 Protons have a phenomena known as the Bragg Peak: they tend to lose all or nearly all their energy at their maximum depth in matter.
For the former claim, without crediting the source, Braeunig cited a table reprinted from a paper originally published in 1947 by J.H. Smith who in turn based his numbers on theoretical estimates published in 1937.11 Smith reported that 8.182g/cm2 of aluminum will stop a 90MeV proton. As for the equivalent of Artemis’s shielding: Smith also reported that 17.77g/cm2 will stop a 140MeV proton, and 22.4g/cm2 will stop a 160MeV proton. However, these ranges seem to be contradicted by other, much more recent sources, associated with NASA.
For example, in his NOAA Technical Memorandum, J.A. McKinnon provided some estimates for skin and body doses that astronauts would have received had an Apollo mission been active during the major solar activity of August 1972. Based on proton data acquired from Explorer 41 (at energy intervals of E >10MeV, E > 30MeV, and E > 60MeV) and ATS-1 (which measured protons at energies between 21-70MeV) these estimates imply that such >10MeV protons can penetrate the Apollo spacecraft.
Furthermore, on page 38 McKinnon specifically states that his estimates are based on dosimeter readouts from past Apollo missions and corresponding measurements taken by those unmanned satellites:
Dose rates and cumulative doses are predicted for two critical organs, namely, the skin and the blood forming organs (~5cm depth) under three shielding configurations – free space, the Lunar Module (LM), and the Command Module (CM). These predictions are confirmed and modified by readouts from dosimeters and particle detectors carried on board the Apollo spacecraft or worn by the crewmen. During manned missions, real-time proton fluxes are available from the Solar Proton Monitoring Experiment on board NASA's Explorer 41 (IMG G) satellite and from other spacecraft. [Emphasis added]
On the following page, McKinnon presents a table using the August 1972 30MeV solar proton data from Explorer 41, and estimates a depth dose of 91rem for free space (or inside the spacesuit) and 34rem for inside the CM.
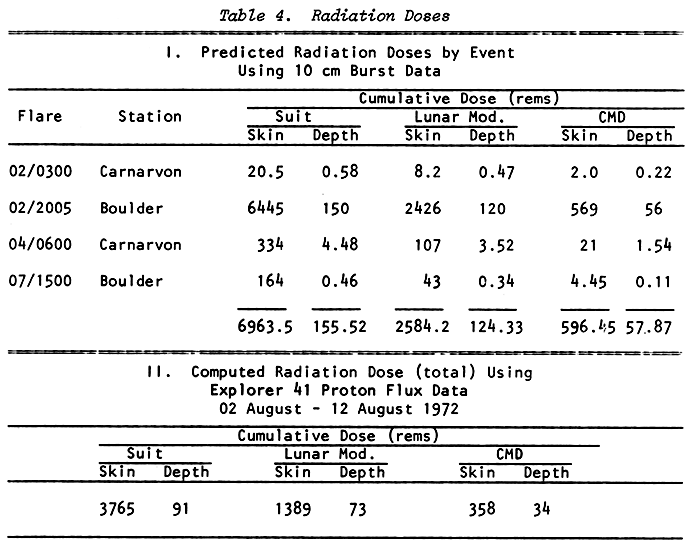
Fig 5. J.A. McKinnon’s Table 4: Radiation estimates for skin and body doses that an Apollo astronaut would have received from 30MeV protons during the high solar activity of August 1972. Carnarvon station is on the Western Australian coast, north of Perth. Boulder station is inland, at the foothills of the Rocky mountains in Colorado, USA.
This suggests that at best, the CM reduces the dose from 30MeV protons by a factor of 2.67291354. Perhaps that reduced factor accounts for the <10MeV protons stopped in the CM hull?
Moving over to shielding offered by the Orion capsule, S.P. George et al. provide a table comparing the daily galactic cosmic ray (GCR) dose rates (in mSv/day) inside Artemis I with various other locations in space:
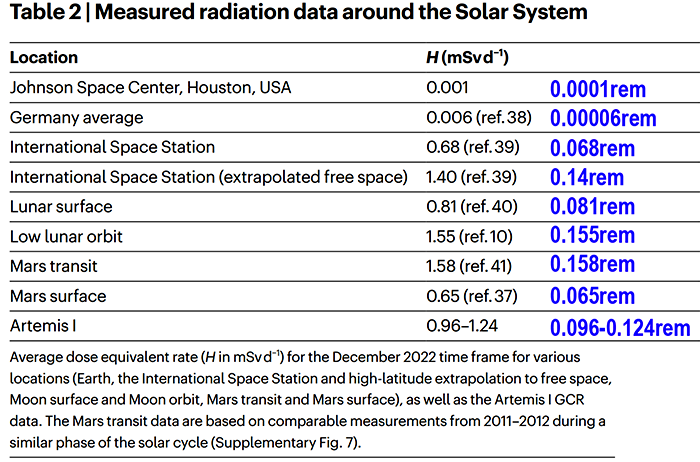
Fig 6. Table 2 Note: The source of the low-lunar orbit data is from NASA; the lunar surface data is from China’s National Space Agency (CNSA). S.P. George et al. 2024. See also annotated version with radiation unit conversions.
Looking at this table (I have made the mSv to rem conversions) we see that the daily dose rate inside Artemis I ranged between 0.96-1.24mSv/day (0.096-0.124rem/day), versus 1.55mSv/day (0.155rem/day) as measured by the Lunar Reconnaissance Orbiter and 0.81mSv/day (0.081rem/day) as measured by the Chang’e 4 lander on the lunar surface. This implies that the shielding on Artemis either reduces the dose rates by 20-38% or increases it by 12-53% !
Curiously, in the methods section of the SP George et al. paper, we are specifically told this about the MARE Phantom M-42 detectors:
The DLR M-42 battery-powered radiation detector uses a 1.22-cm2-area and 300-µm-thick silicon photodiode for the measurements of the space radiation environment. The instrument measures the energy-deposition spectra in the detector applying 210 energy bins (distributed in equidistant logarithmic bins with 75 bins per decade). With this, the energy-deposition range (in Si) for the detector ranges from 0.06 to more than 20 MeV. The highest channel is used as an overflow channel. All energy depositions above the upper threshold are denoted to this channel. [Emphasis added]
Just how much greater than 20MeV are we considering? In writing about the ESA’s Active Detectors (EAD), we are told:
The relevant energy-deposition ranges (in Si) are 0.055–16.496 MeV for the 300-µm-thick diode and 0.194–27.613 MeV for the 7-µm-thin diode.
Firstly, if 8g/cm2will stop all protons up to 100MeV, as claimed by Braeunig, why do S.P. George et al. cap the upper limits of the Helga and Zohar’s detectors off at “more than 20 MeV?” The same question applies to capping the ESA’s EAD detectors at 27MeV. Remember, the Orion has nearly thrice as much shielding as Apollo. And both energy levels are below Braeunig’s purported attenuation limit of 100MeV for Apollo’s inferior shielding, never mind Smith’s purported 160MeV attenuation limit for 22g/cm2! ESA’s threshold of 27MeV is below the purported maximum attenuation offered by the two generations of lunar spacecraft shielding. It would only make sense if particles at such energy could penetrate the spacecraft hull to reach the detectors in the first place. And for NASA’s higher threshold, just how much “more than 20MeV” are we actually talking about? Throughout their 2024 paper, S.P. George et al. discuss the detection of protons ranging from a few keV up to <27MeV. The only mention of 100-200MeV protons is in the context of testing the HERA detectors prior to launch.
Secondly, why are the detections from any radiation with E >20MeV being denoted to the 20MeV channel? Why are there not channels specifically for >100MeV or >200MeV particles? As shown in my own AP-8 calculations, during transit of the heart of the inner belt, what the higher energy protons lack in flux they compensate for in the energy they deliver – resulting in higher radiation doses. In his 1983 paper, E.E. Kovalev reported doses from 200MeV protons alone, to be several hundreds of rem per day. Recalculating everything to a lower energy will result in underestimated doses. It’s like building a multi-storey car park under the assumption that all cars parked inside it will each weigh exactly 1,000kg – an abundance of cars above this weight would push your car park’s supporting foundation beyond their lifting limits.
In my MoonFaker: Radiation Reloaded video, I did my own calculations in response to Braeunig’s. I took the coordinates attributed to Apollo 11’s outbound trajectory and plugged them into the AP-8 Max model for the Van Allen proton belt. The resulting proton fluxes were used to calculate the absorbed dose and, through the appropriate radiation weight factors, the equivalent dose.
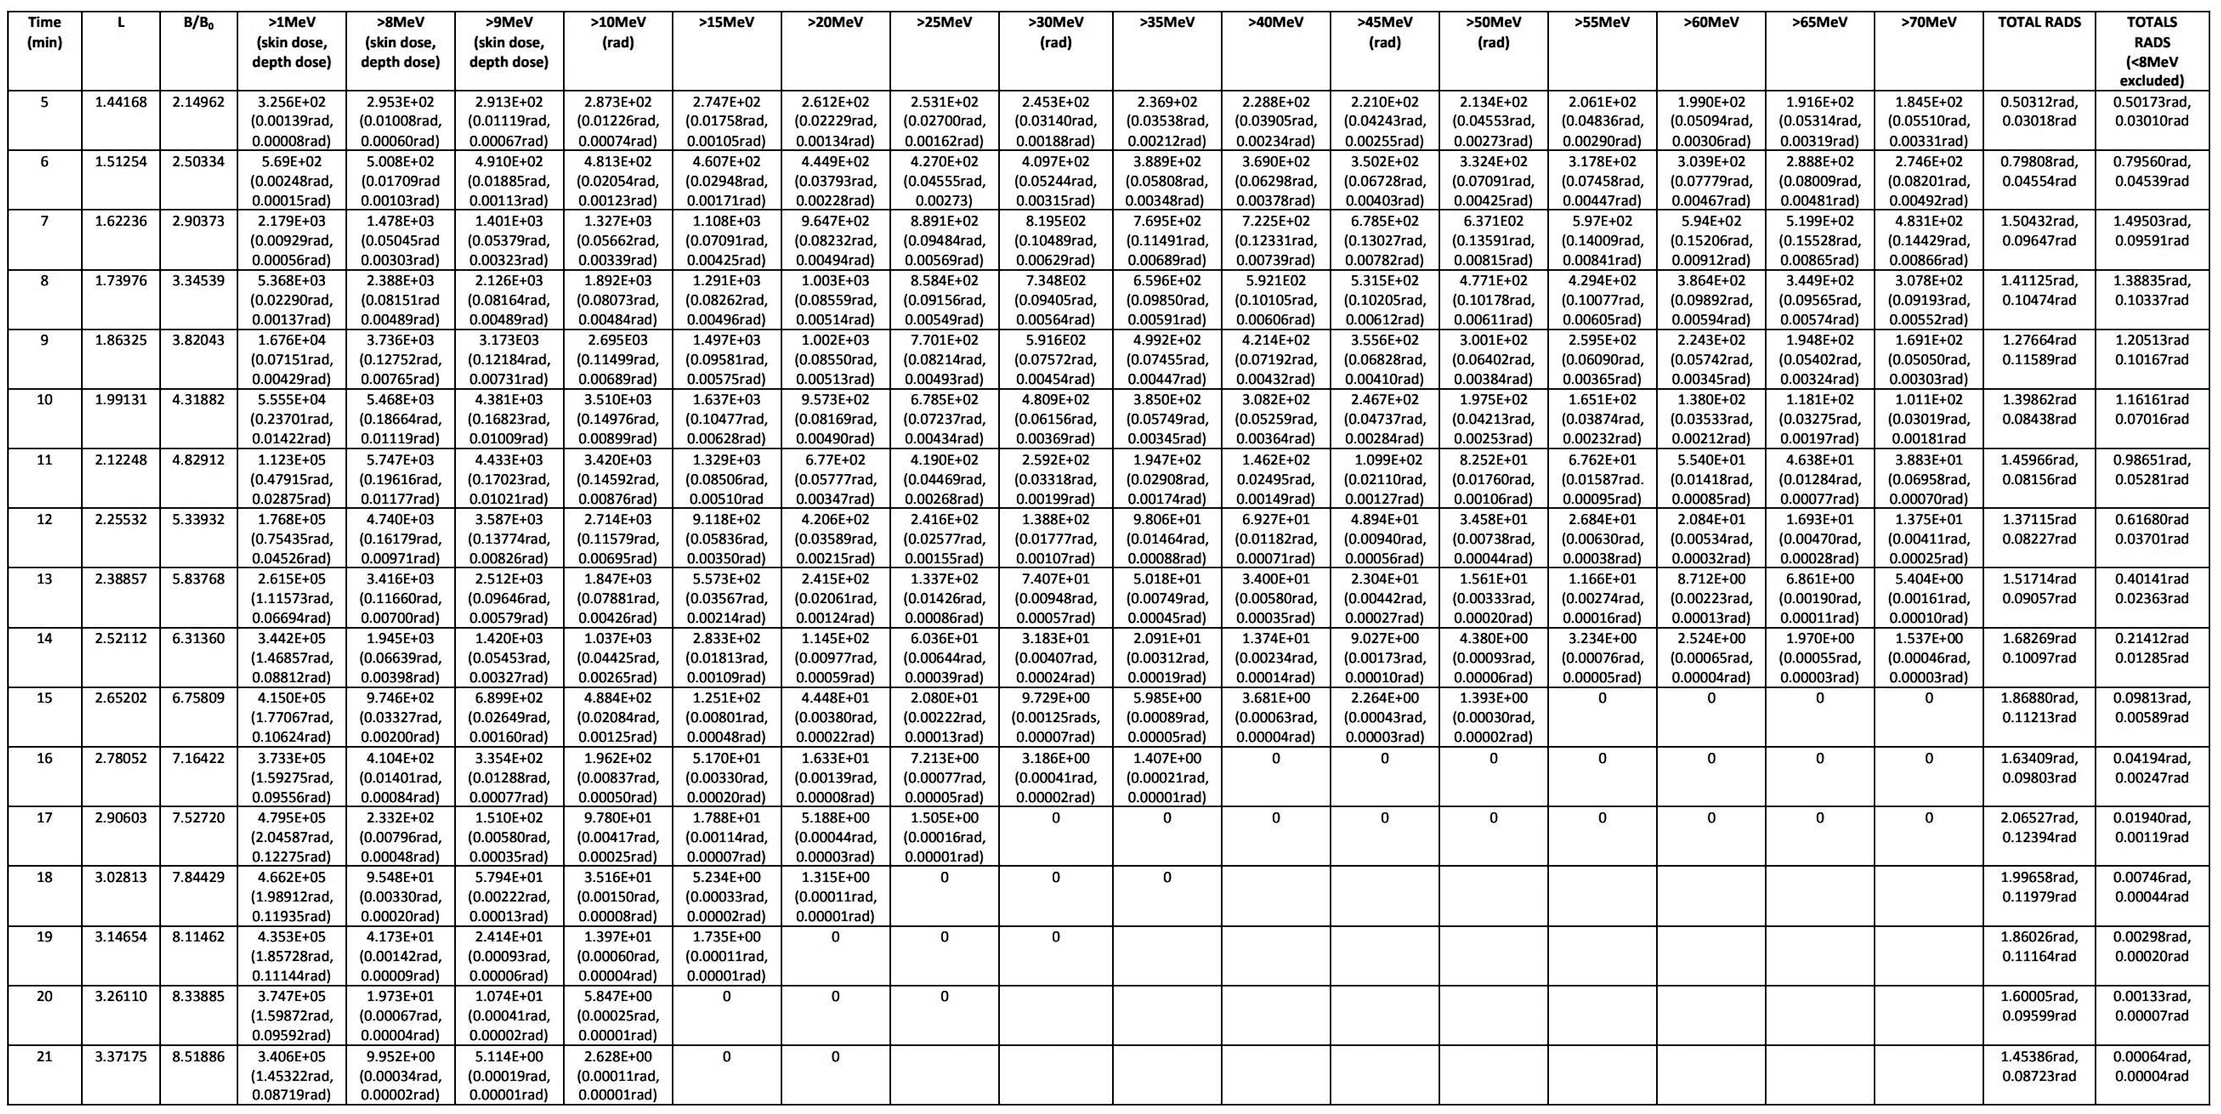
Fig 7. This table is a sample of Apollo 11’s purported coordinates when traversing the inner Van Allen belt, the corresponding AP-8 proton fluxes for each coordinate, and my calculated proton absorbed doses. Click to enlarge
I focused purely on the protons with energies between 8-400MeV, since J.W. Keller et al. 1963 suggested that 8g/cm2 of aluminum will stop all protons up to 8MeV.
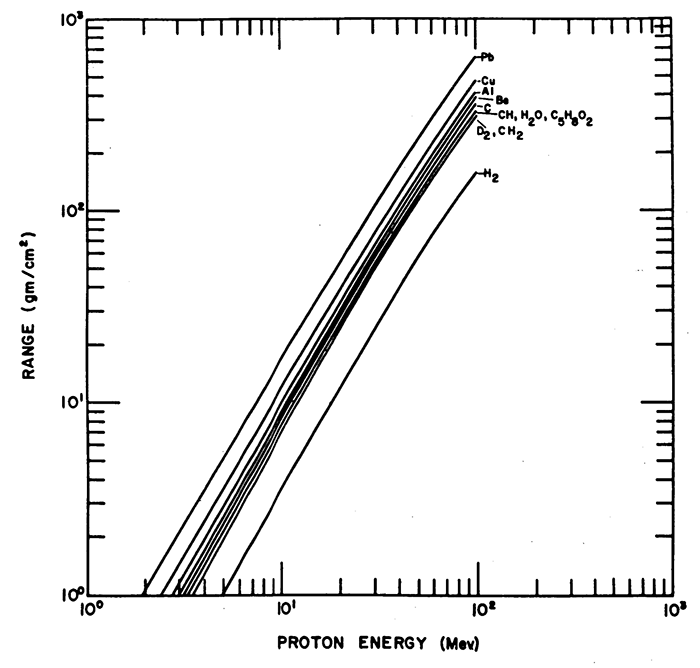
Fig 8. The graph plotting proton attenuation as a function of proton energy. Annotated to show the attenuation offered by Apollo’s 8g/cm2 of shielding. This graph suggests the CM walls stopped all protons up to 8MeV. J.W. Keller et al 1963.12
The resulting equivalent dose was between 33.23rem and 99.7rem, depending on the AP8’s tendency to underpredict the fluxes by a factor of three.13 Some secondary doses from neutrons were also estimated.
Fig 9. Comparison of the AP-8 predictions versus actual measurements made by the TIROS/NOAA satellite. C. Poivey (2002).
For a shield equivalent to 20g/cm2 of aluminium, J.W. Keller et al. calculated that all protons up to 15MeV would be attenuated. Subtracting that from the totals that I calculated for Apollo 11, brings the proton dose rate down to between 31.5rem and 94.4rem, again depending on the AP-8 tendency to underpredict the fluxes.
Apollo versus Artemis
Obviously, neither the Apollo nor Artemis shields will attenuate the higher energy Van Allen or solar protons with energies measured in tens to hundreds of MeV, and they certainly will do nothing to stop the ever-present galactic cosmic rays (GCR) with energies all the way up into the GeV range. However, as stated in the previous section, radiation measurements generally show an inversely proportional relationship between proton flux and energy. Notwithstanding the difficulty in trying to measure high energy particles due to their great penetrability, given that the lower energy protons tend to be easier to detect – thus appearing more prevalent – and given that Artemis has the superior shielding of the two spacecraft, we should expect a noticeable reduction in the readouts compared to those attributed to Apollo.
As a benchmark, the official skin doses for all the Apollo missions were published by NASA in 1975.14
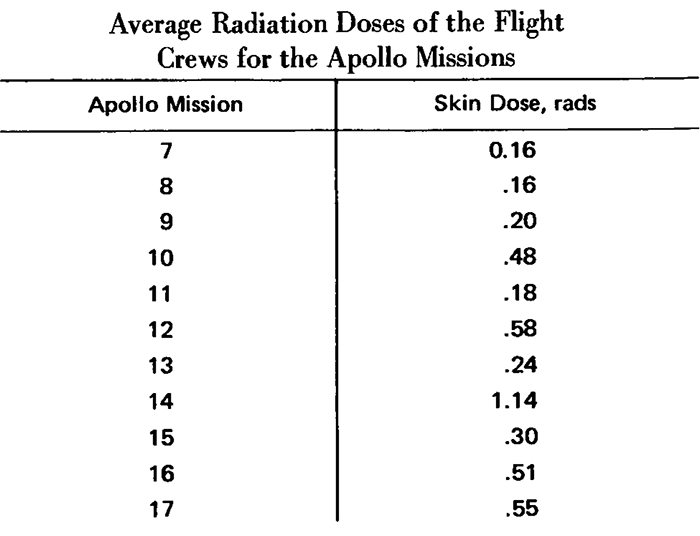
Fig 10. Official skin doses for each Apollo mission. NASA.
A quick look shows that the skin doses vary between 0.16rad and 0.58rad. Apollo 7 and 9 were both low-Earth orbit missions below the Van Allen belt, yet the dose for the Apollo 7 crew is identical to that of the Apollo 8 crew scheduled for a lunar orbit mission. While Apollo 9 crew data is comparable to the doses acquired by the crews of the first scheduled lunar landing mission Apollo 11, and the improvised circumlunar mission designated Apollo 13. As for Apollo 14, the crew data is listed anomalously higher than all the others, at 1.14rad. In Chapter 10 of the official Apollo 14 Mission Report, we are told this is because:
The translunar injection trajectory lay closer to the plane of the geomagnetic equator than that of previous flights and, therefore, the spacecraft traveled through the heart of the trapped radiation belts.15
This alone raises some red flags. On page 254 of Astronautical Engineering and Science, J.W. Keller et al. write:
The resulting shield thicknesses [required] are seen to be quite formidable with ~100g/cm2 needed to reduce the total dose rate to ~1 roentgens/hr [0.877rad/hr]. Consequently, due to the very large shielding penalty involved, the intense regions of the inner Van Allen belt will probably be a forbidden region for manned orbiting vehicles. Conversion added.
It should also be noted that these official skin doses consider the entire trajectories undertaken by the Apollo missions, not just the transit through the radiation belts. So how does the Artemis I data compare?
Reading through their 2024 paper, S.P. George et al. repeatedly alternate between using microgray (µGy) and milligray (mGy) in referring to the absorbed doses and dose rates. Some equivalent doses are also specified in milliSeverts (mSv), which were calculated using radiation weight factors ranging between 1.24 and 3.39.
For the sake of consistency, I will be converting all the absorbed and equivalent doses to rads and rem respectively for the remainder of this article.
S.P. George et al. 2024 conclude their report with:
Total mission dose equivalents were 26.7–35.4 mSv, [2.67rem–3.54rem] with between 1.80 and 3.94 mSv [0.18rem–0.394rem] attributable to the belt passes. [Conversion added]
D. Laramore came to a similar conclusion on Slide 21 of his presentation, but provides an even lower total dose for the mission:
Artemis I mission radiation exposure would not pose a significant acute or chronic health risk to crew members
• 22.3 mSv [2.23rem] against astronaut career limit of 600 mSv. [60 rem]4 [Conversion added]
Both cannot be correct, so which is it? Curiously, on slide 20 Diego Laramore refers to this 22.3mSv figure, not as an equivalent dose, but as the total effective dose. These are not the same thing and the difference between the two not only matters significantly, it also gives the entire game away – as we will see later in this article. But first, let’s start with the absorbed doses.
Writing about Artemis I’s passage through the inner proton belt, S.P. George et al. report that the lowest absorbed dose rate was detected by M-42 SN127. This particular detector was positioned on Helga’s back and measured the dose received by her rear skin. It was reported to be 69µGy/min (0.0069rad/min). Meanwhile, the Van Allen proton dose rates measured by the two detectors, EAD MU01 and HERA HSU2, peaked at 287µGy/min (0.0287rad/min) and 240 µGy/min (0.0240rad/min) respectively. The peak dose rates for the electron belt are unspecified in the text, but the graph suggests a dose rate peaking at ~4µGy/min (0.0004rad/min), as measured by HERA HSU2.
As an aside, there appears to be another contradiction between data from S.P. George et al.’s 2024 paper and D. Laramore’s 2023 lecture slides. Artemis I crossed the Van Allen belts on November 16, 2022. As to the exact time this occurred: S.P. George et al. claim that the inner belt was crossed between 7:12–7:42am UTC and the outer belt between 8:45–10:45 UTC. D. Laramore on the other hand narrows it down to the second and claims the crossing of the inner belt occurred between 7:11:11–7:46:41am and the outer belt between 8:27:00am–13:24:11pm. So much for rushing through the belts quickly: that’s a difference of an extra 5.5min in the inner belt and 3hrs and 39min in the outer belt!
Reading through slides 23 and 24 of D. Laramore’s WRMISS lecture and slides 14 and 21 of a separate lecture that S.P. George gave at the 24th International Workshop on Radiation Imaging Detectors (IWORID 2023) in Oslo,16 it appears that they have used, as their cut-off, the time at which the data for HERA merges to a steady output. The top left section of George’s Slide 14 shows that between 9am and 10am, HSU2 was picking up a lot more electron radiation that the other two HERA detectors.
Fig 11. HERA readouts for the transits through the Van Allen belts, as shown on Slide 14 of S.P. George’s IWORID presentation.
The same thing seems to occur with Laramore’s Moonikin Campos readouts. In Slide 23 of his presentation, it looks as if it is around the same time that the Moonikin’s blood forming organs (BFO), skin and lens are detecting distinctly different levels of electron radiation, before all three data readouts merge.
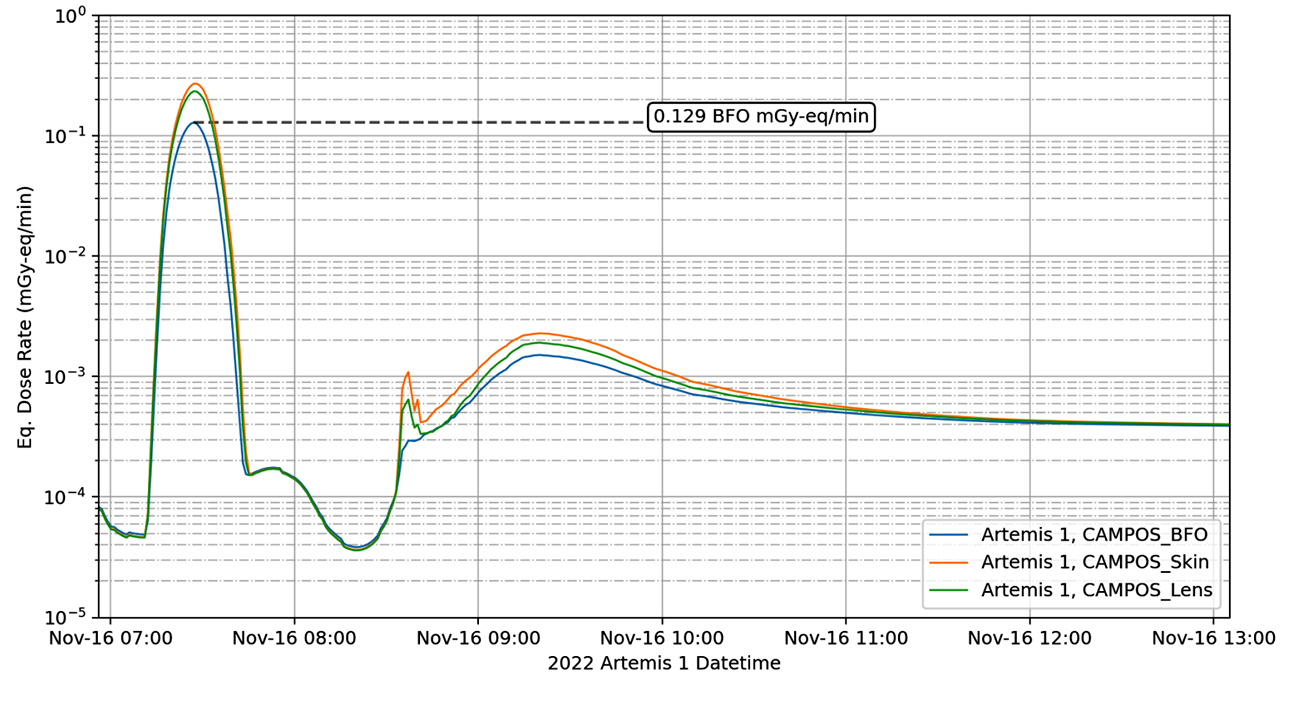
Fig 12. Moonikin Campos readouts for transit through the Van Allen belts, as shown on Slide 23 of D. Laramore’s lecture. click to enlarge
J.E. Barzilla et al. 2024 published readouts for each HERA detector during their transit through the radiation belts.17 There are noticeable breaks in the outer belt data just before 9am and again around 10:45am to 11am. Perhaps the detectors became jammed by an enormously high level of radiation? As was the case on Van Allen’s original Geiger counters aboard the Explorer satellites.18 It’s important to note how the grey shadings (Fig.13) represent the periods Artemis I was in the radiation belts. The beginning of the electron belt shading is consistent with the probe entering at ~8:45am, but the exit is implied to be 12pm – between the conflicting exit times reported by S.P. George et al. and D. Laramore.
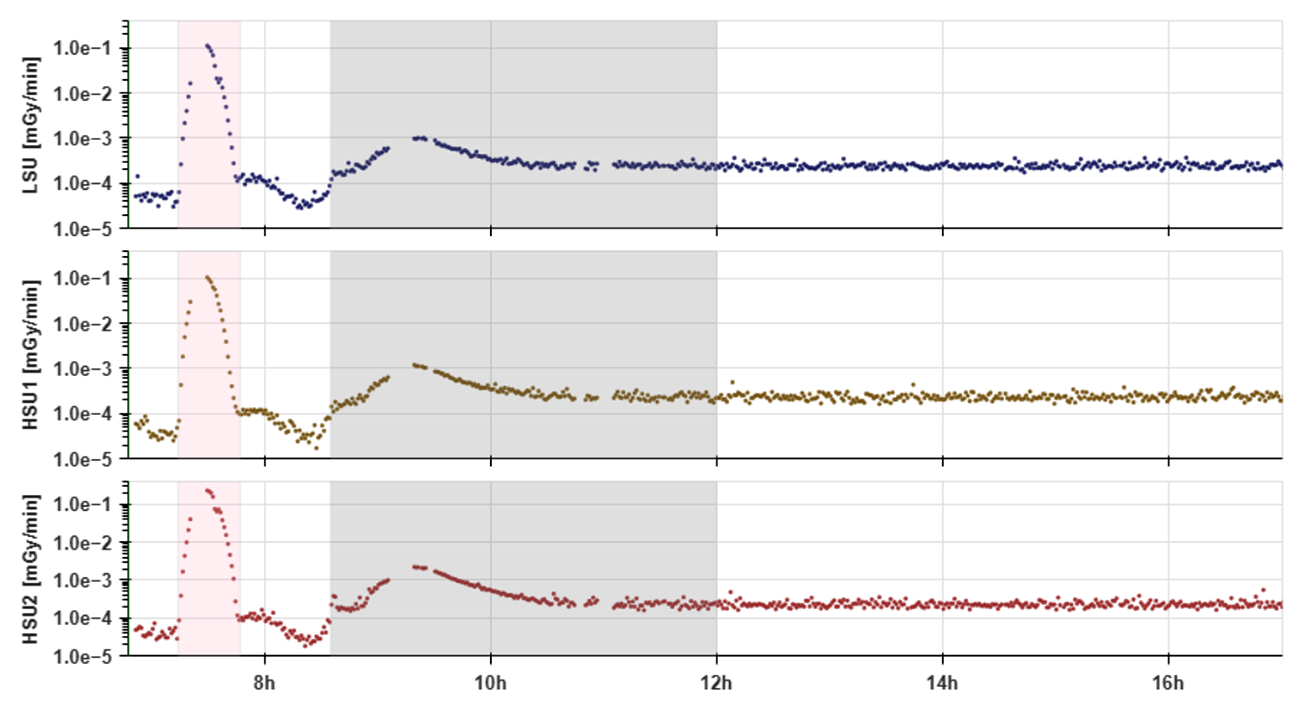
Fig 13. HERA readouts for the transits through the Van Allen belts, as reported by J.E. Barzilla et al. 2024. click to enlarge
In purely physical terms, and according to their own instrumentation, Artemis I actually took a total of 6 hours 32mins and 41seconds to travel through the VABs from beginning to ending. So how can NASA issue two different timelines?
A possible cause for this discrepancy could be differences of opinion among the authors as to what they consider to be the ‘end’ of the outer belt. Some sources put the end of the outer belt at 25,000km while others put it at 60,000km, which has led to some confusion as to whether or not geostationary satellites occupy the outer belt. To clarify, as reported by H.O. Funsten et al. 2013 and as G.D. Reeves told me in a personal communication, the most intense region of the outer Van Allen belt occurs between 4–5 RE where the most penetrative electrons are most prevalent. But at geostationary orbit (~5.6 RE) you will be lucky to find any electron with E >1MeV. Because of the relative lack of penetrating electrons that far out, electrons that would be of concern, some astronomers consider 25,000km the end of the belts. While others take into account the remaining non-penetrative electrons beyond that point, and put the end of the belt at 60,000km. [4-5 RE = 25,512-31890km; ~5.6 RE = ~35,717km, when the Earth radius is of 6378km: source NASA].
Indeed, the Barzilla et al. graph shows a sudden large spike in electrons, followed by a steady slope for the remainder of the electron belt transit before transitioning into a relatively quiet state of background cosmic rays. The large spike starts to slope noticeably before the 10am mark and significantly flattens beyond 10:30am. Thus, it is possible that S.P. George and D. Laramore might be in different camps in this regard. Perhaps George focuses on the electrons that would be of concern to a spaceflight, and considers 25,000km to be the ‘end’; whereas maybe Laramore considers all elections, penetrative or not, and regards 60,000km (9.4 RE) as the ‘end’?
Still, the fact that Laramore’s lecture slides are marked ‘NOT FOR REDISTRIBUTION’ on every page is very concerning and leads one to wonder if it slipped through the net in order to highlight the differences between facts and fictions. Perhaps there are concerns among the world’s radiation experts as to the presentation of these data.
S.P. George sticking with a total Van Allen belt traverse of only 3hours 15mins, is suggestive of a wish to mitigate any discussion about a) Apollo timelines, and b) avoid potential problems involving the belts (such the creation of a third belt etc.) interfering with their already problematic radiation data.
For comparison, in my AP-8 calculations for Apollo 11, I found that the proton doses begin during T+5min after TLI and end at T+24min after TLI. So that’s 20minutes in the proton belt for Apollo 11 and between 30-35.5min for Artemis I.
For the remainder of the flight, the Galactic Cosmic Ray (GCR) readouts from the various detectors are plotted in the graphs published by S.P. George et al. 2024.
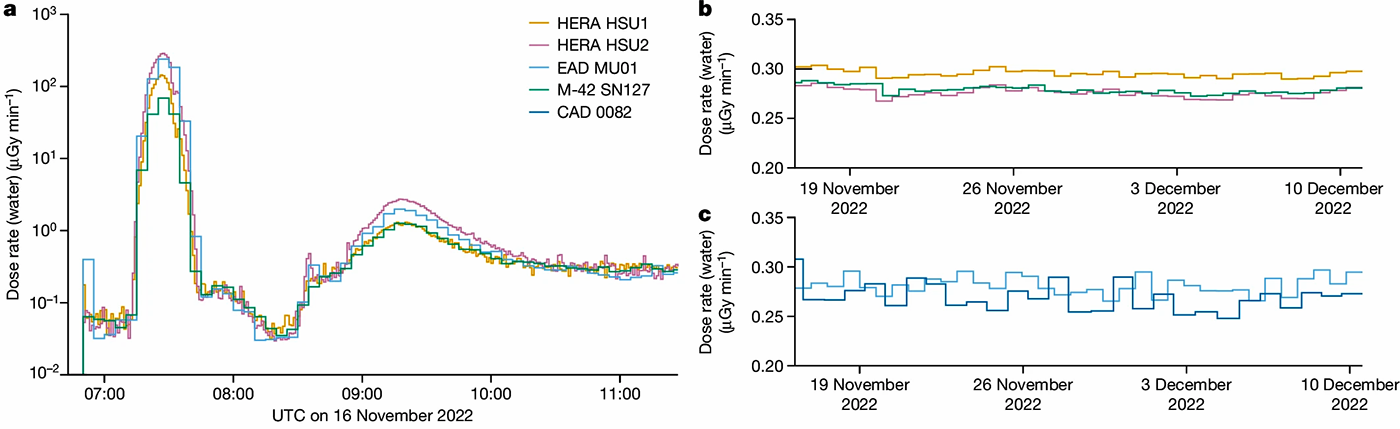
Fig 14. Readouts for various detectors aboard Artemis I during the mission, reported in absorbed dose/rates. A is the transits through the inner (left peak) and outer (right peak) Van Allen belts. B and C represent the cosmic ray dose rates for the remainder of the mission. S.P. George et al. 2024. click to enlarge
From these data we can see that, despite being locked away behind the bulkhead of the cargo bay intended to double as a makeshift solar storm shelter, HERA HSU1 received the highest dose rate throughout the mission. Its curve fluctuates along the 0.3µGy/min (0.00003rad/min) interval. The GCR readouts from HERA HSU2 and M-42 SN127 seem to cluster around 0.27µGy/min (0.000027rad/min).
Because there are 1,440minutes in one solar day, even if we take the lower end of this range that would imply ~0.039rad/day. Thus, for an eight-day mission this would yield 0.312rad. Looking back to NASA’s officially reported doses, we can see this 0.312rad figure for an eight-day Artemis mission falls between the doses attributed to Apollo 10 (0.48rad) and Apollo 11 (0.18rad). If we take the S.P. George et al. figures of 0.18rem–0.394rem and divide them by their reported radiation weight factors of 1.24 and 3.39, this gives us an additional Van Allen absorbed dose of between 0.05rad and 0.32rad, bringing the total dose for an eight-day Artemis mission to between 0.362rad and 0.632rad. The former number is still between those attributed to Apollo 10 and 11, but the latter is even higher than the 0.55rad attributed to the twelve days of Apollo 17.
For a more precise analysis, S.P. George et al. provide a table of the accumulated doses as recorded on Artemis I by Helga in mGy. Again, for the reader’s convenience, I have annotated it with mGy to rad conversions. This table specifically focuses on the M-42 detectors intended to measure the radiation doses in Helga’s skin, lungs, stomach, spine and uterus.
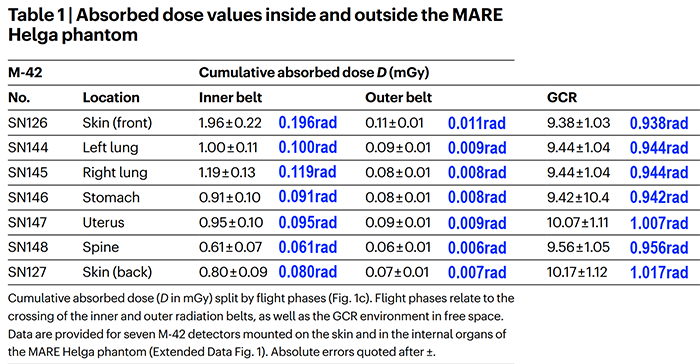
Fig 15. Absorbed dose values inside and outside the MARE Helga phantom. S.P. George et al 2024. See also annotated version with radiation unit conversions.
Since NASA only reported the Apollo astronauts’ skin doses, we focus on the M-42 readouts SN-126 (front skin) and SN-127 (rear skin). The total skin dose for Helga’s exposure to the inner and outer Van Allen belts is 2.94mGy (0.294rad).
For GCR exposure, the front skin acquired 9.38mGy and the rear skin 10.17mGy, bringing the total GCR exposure to 19.55mGy (1.955rad). Dividing this total by the 0.039rad/day as suggested by their previous graph would imply a mission duration of 50.13days! Clearly, this is inaccurate. From launch at 06:47:44 UTC (01:47:44 EST on Nov. 16, 2022 to splashdown on Dec. 11, 2022, at 17:40 UTC (9:40 am PST) west of Baja California near Guadalupe Island, the mission lasted for 25 days, 10hours, 53minutes or some 25.45days. Helga’s total skin exposure of 1.955rad + 0.294rad = 2.249rad. Dividing this 2.249rad by Artemis I’s mission duration of 25.45days = 0.088369351 rad/day. Or 0.0768172888rad/day from cosmic rays alone.
Clearly, S.P. George et al. 2024 are providing their readers with conflicting data. Did they make an error somewhere while processing it? Or is there an obligation to downplay the radiation hazard such that the Artemis II mission could get the go-ahead for a manned flight? I’ll leave it to them to explain themselves.
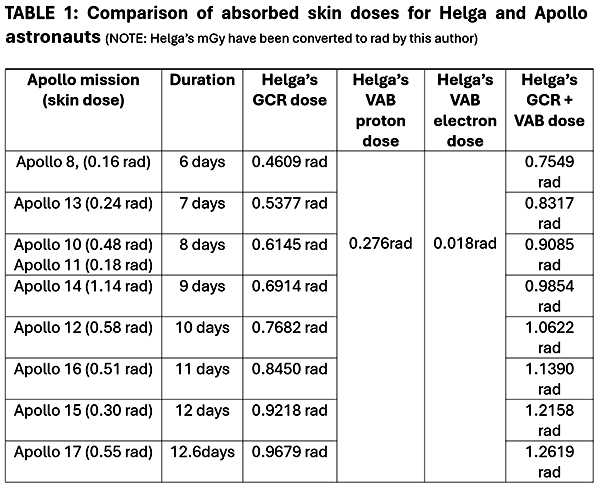
Nonetheless, we can multiply Helga’s daily GCR dose rate of 0.0768172888rad/day by the duration of each Apollo mission (Col 3 in table below) to see how these calculated doses compare to what was reported. Because the Van Allen belts only represent a small portion of the overall mission, they can be isolated. Only the GCR doses will change, based on mission duration.
The most obvious direct comparisons between the flight of Artemis I and the data concerning the Apollo flights are Apollo 8 and 10, scheduled as lunar orbit missions. Prior to Artemis I, NASA claimed Apollo 13’s circumlunar mission to be the furthest distance travelled by a man-rated spacecraft. So that is another good comparison. However, for the sake of thoroughness, NASA’s stated data for all Apollo missions are compared.
Let’s get this out the way real quick: adjusting for the difference in duration of transit through the inner Van Allen belt (20min for Apollo 11 versus a minimum of 30min for Artemis I) would only take 0.092rad off the totals. This is a negligible reduction.
In looking at this table, we can see that, with the exception of Apollo 14, all of the Apollo missions have cumulative skin doses far less than Helga’s reported skin dose adjusted for each mission’s respective duration. There should be no such discrepancies. At best, the adjusted Helga skin dose is still nearly twice as high as the Apollo 12 skin dose; and at worst it over five times as high as Apollo 11. Most shockingly, Helga’s skin dose for the Van Allen belts alone is greater than the skin doses attributed to the Apollo 8, 11, and 13 astronauts for the entirety of their respective missions! And that’s despite Artemis I having nearly thrice as much shielding as Apollo, and both generations of lunar missions reportedly having similar parking orbit inclinations (29.71° for Artemis I)19 prior to translunar injection.
Apollo 14 is the only exception. Helga’s skin dose adjusted for duration is less than that of Apollo 14. But still, not by much. Again, NASA attributes Apollo 14’s abnormally high skin dose of 1.14rad to crossing the heart of the proton belt. So, what’s Helga’s excuse? It should be drastically lower than what was attributed to Apollo 14, not marginally.
Of course, the skin dose is only part of the story. For the sake of thoroughness, we should also consider Helga’s body dose.
The sum of the inner belt doses for her lungs, stomach, uterus and spine is 0.466rad. Or 0.371rad if we exclude her uterus. And 0.04rad for the outer belt, or 0.031rad excluding her uterus. With the skin doses added, this would be between 0.647-0.742rad (3.235rem-3.71rem) for the inner belt and 0.049-0.058rad for the outer belt, again, depending on whether we count the uterus. Obviously, the other internal organs will be irradiated too, so these organ doses should only be considered a partial body irradiation. Looking at the doses for each organ, we see they are about evenly irradiated. With each organ receiving a dose in the ballpark numbers of 0.1rad from the proton belt, 0.009rad from the electron belt, and 0.94rad from cosmic rays. Therefore, we can assume that had an astronaut been aboard Artemis I, their entire body would have been about evenly irradiated. Thus, we can treat Helga’s individual organ doses as Effective Doses.
A quick radiation recall. Previously we’ve discussed the differences between Absorbed Dose (the amount of radiation energy per mass) and Equivalent Dose (the absorbed dose multiplied by a radiation weight factor). The first tells us how much energy was deposited in a body of biological mass, and the latter tells us what kind of adverse consequences can be expected. Now is a good time to introduce the concept of Effective Dose.
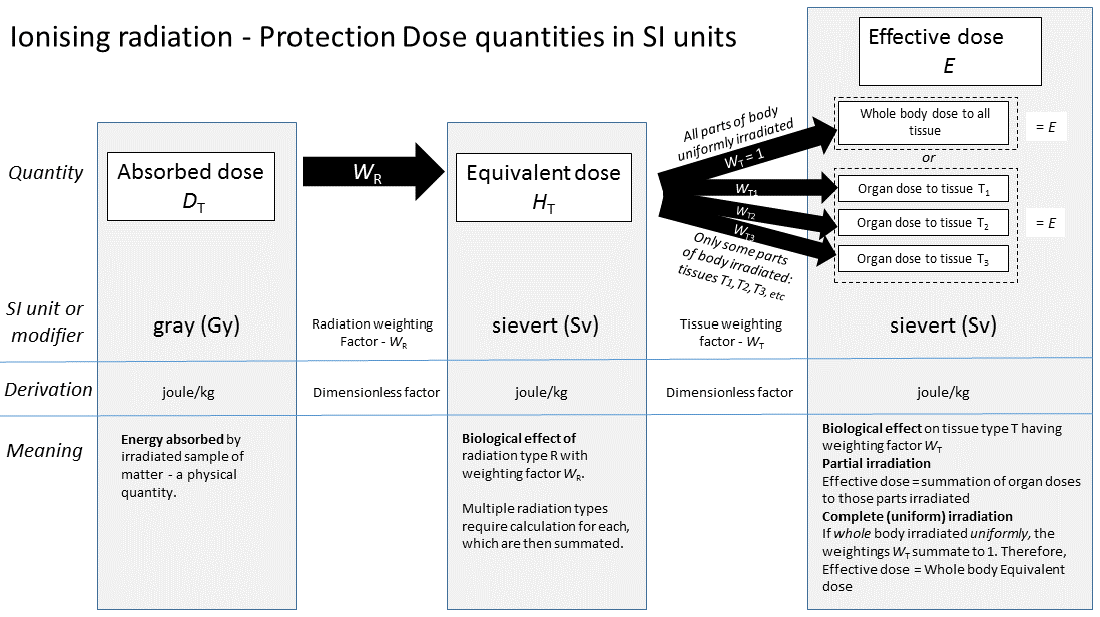
Fig 16. This diagram illustrates the difference between absorbed radiation doses, equivalent radiation doses, and effective radiation doses. click to enlarge
Each body part has its own tissue weighting factor, WT. Each WT represents one of many fractions that all together adds up to 1. The effective dose is simply the equivalent dose multiplied by the sum of the WT for each irradiated body part. For a full body dose, the equivalent and effective doses will be the same. But in partial body doses, the effective dose will be some fraction of the equivalent dose.
Fig 17. Tissue weighting factors Image: W. Sun et al. 2013.20
With this knowledge, in theory, we should be able to set the doses for Helga's lungs, stomach or skin or whatever as an Effective Dose and work our way backwards to find the full body Equivalent Dose. However, in practice, the results proved very inconsistent, but nonetheless alarming. Looking at Fig. 17, we can see that the stomach and lungs each have a WT = 0.12. This means that the 0.1rad for Helga’s left lung and 0.119rad for her right lung amount to 12% of the total full body irradiation. With this knowledge, we can set the dose for Helga’s lungs as an Effective Dose and work our way backwards to find the full body Equivalent Dose.
Of course, the lung doses that S.P. George et al. reported are absorbed doses. We should first convert these to equivalent doses. I'm not sure why they used WR of either 1.24 and 3.39. For electrons, WR = 1. For protons with E > 2MeV, WR = 5. Since the lungs represent 12% of the total dose, we simply divide the dose by 12, and multiply by 100 to find the full body dose. And of course, dividing the lung GCR dose of 1.888rad by the 25.45 days Artemis I was in space gives us ~0.07418rad/day. For a 12-day mission (where D = organ Dose. VABP =proton belt VABE =electron belt GCR= Galactic cosmic rays.):
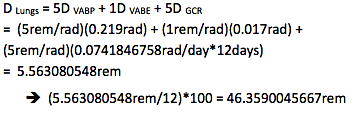
To put Helga’s calculated full body dose of ~46rem into perspective: writing in the National Geographic one year after the catastrophic 1986 Chernobyl nuclear disaster, Mike Edwards reported:
Western experts, using the limited data the Soviet Union has provided, estimate that 24,000 people among the 116,000 evacuees received fairly serious radiation doses of about 45 rem.21
The acceptable dose for nuclear power plant workers is 0.5rem/year,22 with 25rem considered a permissible once-in-a-lifetime dose.23 Any such power plant workers who accumulate 25rem over their career, no matter the duration it was received, are promptly forced into early retirement for health concerns. Because 25rem is equal to fifty years of annual 0.5rem exposures. This rule applies to astronauts too although, as D. Laramore and S.P. George et al. stated, NASA currently considers 60rem as their acceptable limit of an astronaut’s career. According to two-time shuttle astronaut Mary Cleave:
Cancer rates are higher for astronauts. You wear a dosimeter, which you are supposed to keep on your body at all times, to track the amount of radiation you receive. You can get permanently retired based on your radiation dosage.24 [Emphasis added]
I then repeated the calculations seen in table 1 for each Apollo mission duration; the results are in Table 2, below:
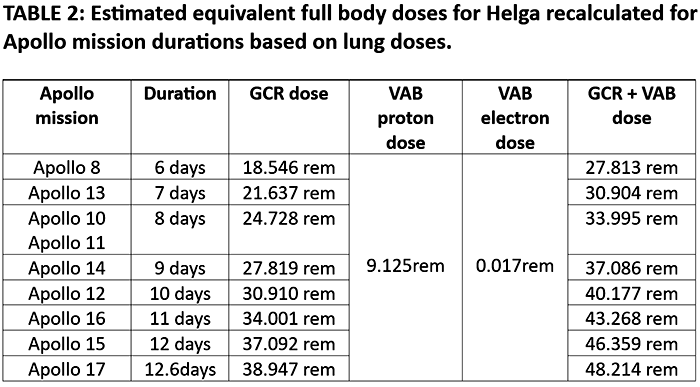
The doses speak for themselves. Each dose is noticeably higher than the acceptable once in a lifetime dose of 25rem. No Apollo astronaut was ever reported to have sustained a dose as high as 28rem or nearly 50rem. Keep in mind that two flights to the Moon were supposedly made by astronauts Jim Lovell (8 & 13), John Young (10 & 16) and Eugene Cernan (10 & 17). Had any of them returned from their first flight with even 28rem, they would never have been allowed to fly in space again due to health concerns.
I could not find the WT for Helga’s spine nor the uterus (the latter of which is not applicable to the Apollo astronauts anyway), but repeating the same calculations for the stomach, I get the results reported in Table 3, below. Note, that the daily GCR dose rate for Helga’s stomach was 0.942rad/25.45day = 0.0370137525rad/day.
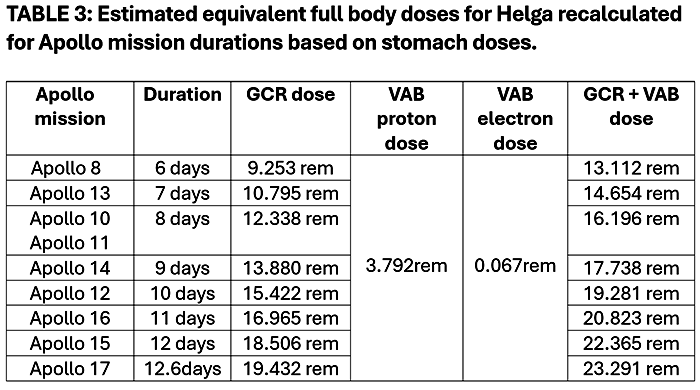
Plugging these new values into formula and crunching the numbers yielded a noticeably lower Van Allen belt dose, reduced by a factor of ~2.4. With the overall total doses reduced by about half of what was calculated for the lungs. Still, the calculated full body doses for the longer durations is close enough to acceptable lifetime limit for power plant workers.
And even a dose of 38rem is enough to cause mild to moderate symptoms of radiation sickness. Nausea, fatigue, vomiting, as well as significant damage to the bone marrow and a consequential drop in red blood cells. Had the Apollo astronauts returned after being exposed to these levels of radiation, they would have required immediate medical attention. There is no record of this happening.
Interestingly, in all the Tissue Weighting Factor tables that I’ve seen, skin is reported to have WT = 1%. And that’s despite McKinnon’s estimates for an Apollo crew exposed to the August 1972 major solar activity receiving a skin dose of 368rem and a body dose of only 34rem, or about 9% of the skin dose. Even Clavius webmaster Jay Windley went on record to say that the internal organs receive only 40% less exposure than the skin.25
Still, as an experiment, I decided to apply the same backwards working calculations to the skin doses attributed to Helga and the Apollo astronauts. Unfortunately, NASA never specified which percentage of those doses were caused by protons and which were caused by electrons. But the Helga doses indicate that the Van Allen electrons represent the smallest portion of the overall dose. So, for simplicity, we’ll multiply the entire absorbed doses for Apollo by the proton WR of 5. Repeating the same calculations as before for Helga’s skin over 12 days, we get:
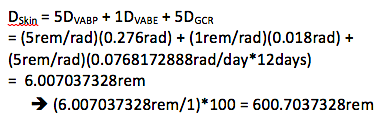
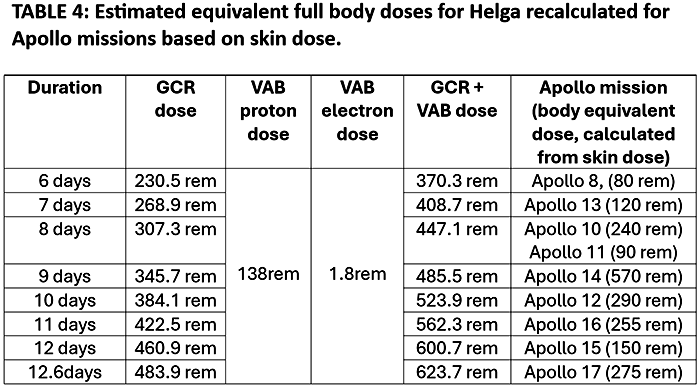
TABLE 4: Equivalent full body doses for Helga recalculated for Apollo missions based on skin dose.
I’m a rather sceptical about the resulting GCR doses. Remember, the Chang’e 4 and LRO data cited by S.P. George et al. puts the range between 0.081rem/day and 0.155rem/day. For a six-day mission, this would be only ~1rem. By comparison, the SP George et al. table also cites doses aboard the International Space Station as 0.068rem/day. NASA has reported that astronauts staying aboard the ISS for six months receive on average, 8rem during solar maximum and 16rem during solar minimum.26 John H. Mauldin reported the yearly GCR dose near Earth as 10rem.
However, this 10rem/year figure applies chiefly to primary radiation. The calculated 138rem for the proton belt is almost identical to the sum of the primary and secondary doses that I calculated in 2016. And in 1963 J.W. Keller et al. calculated that a carbon shield equivalent to that of the Apollo spacecraft in the heart of the inner belt, yielded a secondary neutron dose rate equal to 30% of the primary proton dose rate. In the case of my calculated 99.7rem proton dose, this gives us an additional 29.9rem from secondary neutrons, or a total of 129.6rem.
So, one possible explanation for the much higher CGR could be a secondary dose. 85% of all cosmic rays are high energy protons; 14% of them are helium nuclei (alpha particles); and the remaining 1% are much heavier particles. These are abbreviated as high-Z and energy (HZE) particles. Z is the abbreviation atomic number. For hydrogen, Z = 1, and for helium Z = 2. In the context of astrophysics, any element with Z ≥ 3 is considered a heavy particle and a metal (this is what is meant by the metallicity of stars and gas giants, the proportions of any elements heavier than helium).
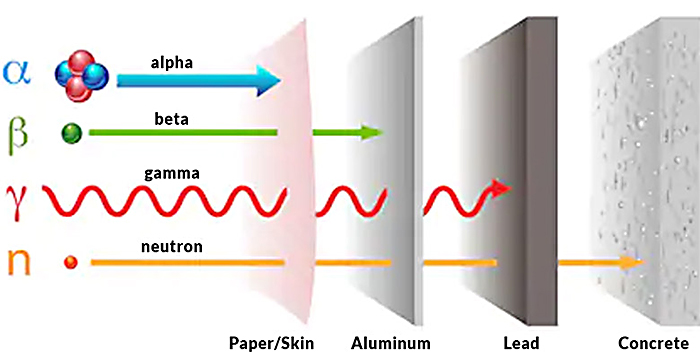
Fig 18. A typical yet oversimplified illustrating how different types of radiation are stopped by different materials.
We’ve all seen textbook diagrams of alpha particles stopped by paper, beta particles (electrons) stopped by aluminium, and gamma-rays stopped by lead. But such diagrams are oversimplified and misleading. They do not consider secondary radiation nor do they illustrate what happens when shield materials are swapped. When alpha and HZE particles collide with aluminium, they are fragmented into secondary particles of lower Z,27 each one sharing a percentage of the original particle’s kinetic energy. This secondary shrapnel radiation doesn’t just include fragments of the original particle, but also protons and neutrons knocked loose from atoms originating from the materials of which the shielding itself is composed.
As an example of this fragmentation in action, astronaut Mary Cleave provides an account of a trick one of her colleagues tried to pull on NASA, which ironically backfired because of this secondary hazard:
I’ve heard about a crew member who was concerned about his total dosage, so he took off his dosimeter and stuck it in a compartment; when that crew came back, there was one person whose dosimeter reading was a lot higher than everyone else’s, and NASA wanted to know why. His dosimeter had picked up a lot of extra radiation in that compartment. [Emphasis added]
In my calculations, for any protons >250MeV, I considered only those striking the top surface area of the astronauts. Because such protons striking areas other than the top of the head or shoulders would pass clean through the astronauts’ bodies and only deposit a very small percentage of their energy.28 A 400MeV proton, the highest energy for protons covered in the AP8, will penetrate 81cm of human flesh. Protons significantly above this energy are what Braeunig should have cited if he wanted to make an argument based on protons passing clean through the human body and doing little damage!
Most cosmic rays have energies up into the GeV range. So, in the case of the GeV protons representing 85% of all GCR, these would penetrate right through the astronauts and deposit only a small percentage of their energy. But for the alpha and HZE particles, which account for the remaining 15% of all GCR, these would fragment into numerous low energy particles yielding 10s to 100s of MeV, and possibly secondary X-rays and gamma-rays in the keV to MeV range.
But perhaps I digress. Another possible cause for such anomalously high GCR doses could simply be not taking into consideration the human body's healing factor. As we established in my previous article, after a 20-23minute exposure to the South Atlantic Anomaly (SAA) region of the inner belt, ISS astronauts have time for their bodies to do some natural recovery against such low levels of radiation. The SAA was reported to have a dose rate of 0.62rad/hr – substantially higher than GCR dose rates as measured by LRO and Chang'e 4. The key difference separating GCR and the SAA from the main belts is that the main belts irradiate their subjects such that they do not give them the luxury of recovery time.
In any case, from the resulting full body doses calculated from the measured effective doses of Helga’s lungs and stomach, we see that an astronaut aboard Artemis for comparable durations as the Apollo missions would have received anywhere between 13rem to 47rem with ~4-9rem being attributable to the Van Allen belts. While the skin dose implies a fatal dose of radiation from the inner Van Allen belt alone. Obviously, all three of these estimates can't be correct.
To be absolutely certain, we'd need to see the readouts for the rest of Helga's organs and add them up. Even if we be conservative and assume each of the other twelve organs absent from the list (i.e. the brain, liver, oesophagus, thyroid, etc) received 0.5rem from the inner belt, the resulting Van Allen dose alone ends up being nearly 10rem. Similarly, if we treat just the skin, lung and stomach doses as 25% of the overall dose, as per their respective WT, the resulting Van Allen dose would still be ~12rem.
As an aside, after repeating the same calculations for the entire Artemis I mission – the entire 25.45days it was in space – I calculated full body equivalent doses of: 43.11rem based on the stomach dose; 87.93rem based on the lung dose; and a whopping 1,117.3rem based on the skin. You'd better hope that healing factor prevails! And even if it did, after recalculating for a full body dose, the data clearly suggests at least ~9rem from the Van Allen belts. Why on Earth would S.P. George et al. 2024 conclude that an astronaut would have been safe aboard Artemis I? Well, as I have flagged earlier, D. Laramore unwittingly or not let the cat out of the bag during his presentation to WRMISS In 2023.
One for all and all for one
A reminder: S.P. George et al. 2024 explicitly stated: “Total mission dose equivalents were 26.7–35.4 mSv [2.67rem–3.54rem], with between 1.80 and 3.94 mSv [0.18–0.394rem] attributable to the belt passes”. The key word there is ‘EQUIVALENTS’. However, Slide 20 of D. Laramore’s presentation characterises these totals differently, as the Total EFFECTIVE dose. He even specifies that these are estimated using NASA’s Tissue Weighting factors – which as already explained, we would only use in scenarios of partial body irradiation. Yet, as demonstrated by the Helga data, each of her organs were irradiation about evenly.
Using Effective doses when they should be considering the Equivalent doses reveals the discrepancy between these two papers and in so doing, virtually begs those in the space industries to pay more attention to the dangers of space radiation on their astronauts. Wittingly or unwittingly, this alert is further flagged by the use of those words: ‘NOT FOR REDISTRIBUTION' on Diego Laramore’s slides.
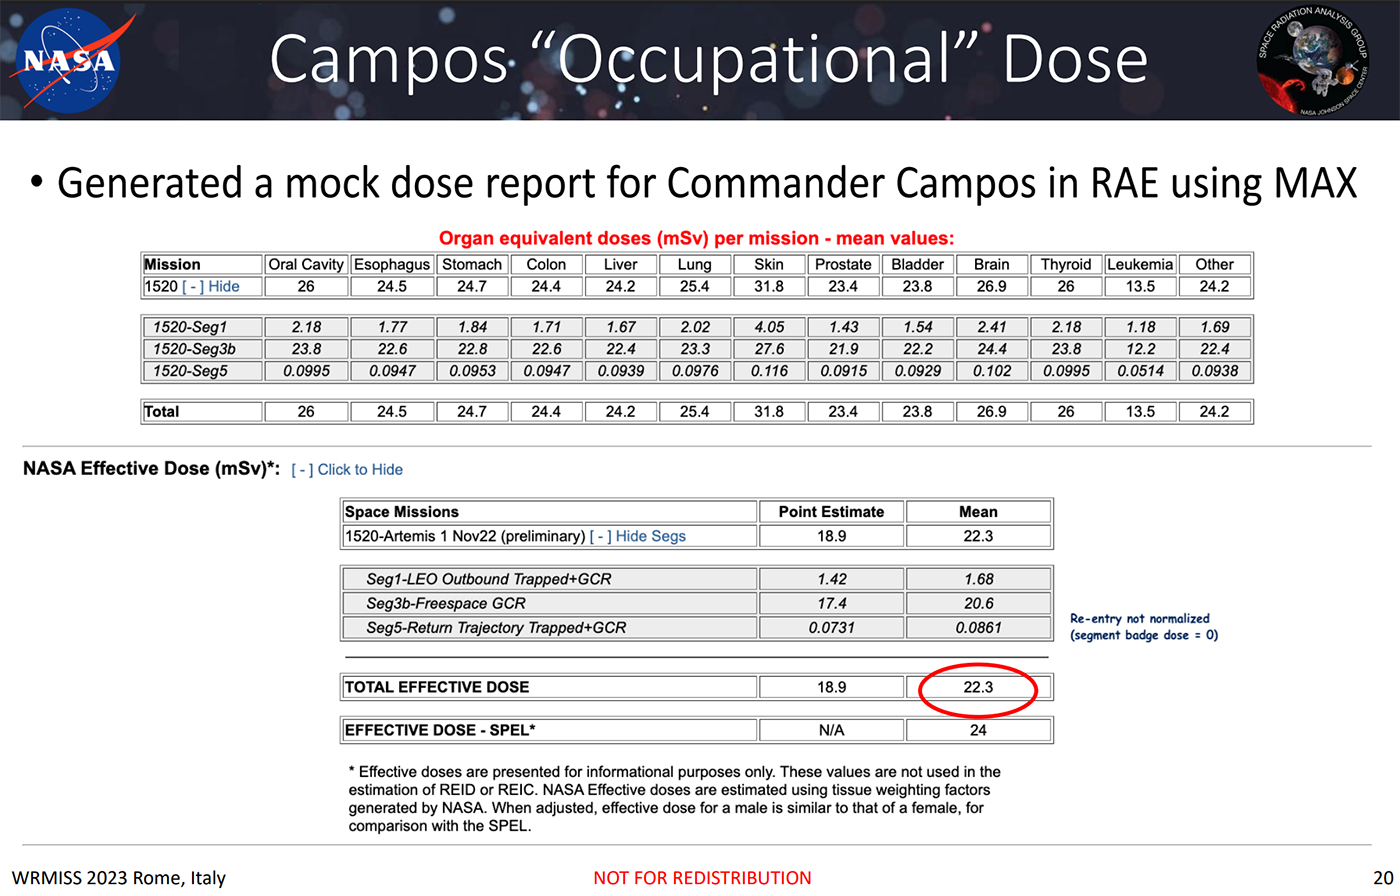
Fig 19. The Campos Mock Dose report click to enlarge
Even more amusingly, that slide is titled thus: “Generated a mock dose report for Commander Campos in RAE using MAX.” I am not sure how this mock dose was generated, but even in this simulation Commander Campos sustained about even irradiation for each of his body parts. I have reproduced it in Table 5 with the doses converted from mSv to rem. I then added them together and found a Total Equivalent dose of 31.88rem.
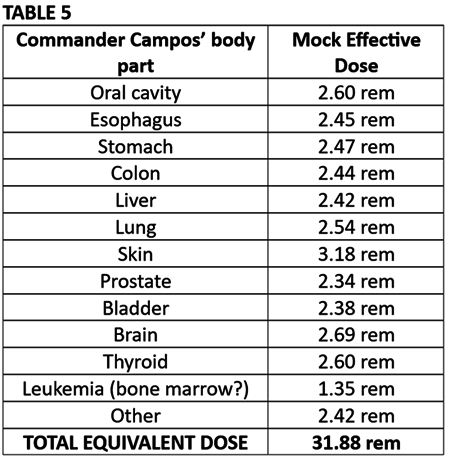
This 31.88rem is comparable to the 43.11rem that I calculated for the full Artemis I mission based on Helga's stomach data. Interestingly, it is also comparable to my calculated AP-8 Van Allen dose for Apollo 11 without applying any correction factors for the AP-8 tendency to underpredict the fluxes. Though I am unsure what percentage of this simulated dose is applicable to the belts. And so we see, even in their mock effective doses for Commander Campos, it is obvious that an astronaut aboard Artemis I would have received more than the acceptable lifetime dose for radiation workers. But rather than add the Effective doses together, like any physics student worth his salt would know to do, it seems D. Laramore and S.P. George et al. 2024 just cherry picked one effective dose for one body part or another and waved it around as ‘proof’ that the astronauts could survive the journey. As if all the other irradiated body parts didn’t matter.
Reading further through S.P. George et al. 2024’s paper, we find that this misrepresentation of an effective dose is indeed exactly what they did. In the appendix of their paper we find Extended Data Table 1, and here the 26.7mSv and 35.4mSv specifically refers to the total equivalent doses measured by HPU and HSU2 for the entire mission.
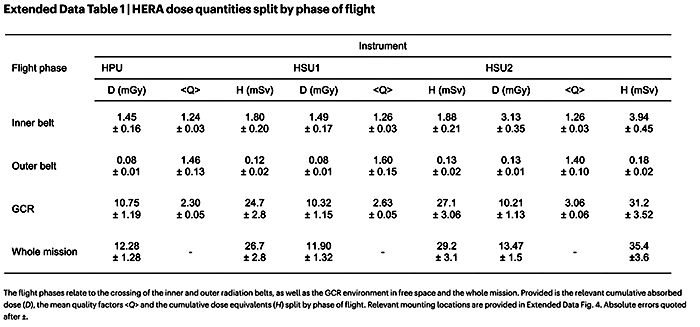
Fig 20. Extended data Table 1: Total HERA absorbed and “equivalent” doses reported by S.P. George et al. Note the similarities between them and the EFFECTIVE skin doses in the next figure.
Looking at this table, we see that the corresponding absorbed doses for these HERA detectors are very similar to what each of the M-42 detectors representing Helga’s organs received. For example, HPU measured 1.45mGy for the inner belt, very similar to the 1.96mGy that M-42 126 measured for Helga’s front skin. For the outer belt, they measured 0.08mGy and 0.11mGy respectively. And for GCR, 10.75mGy and 9.38mGy respectively. The parallels go on and on between detectors.
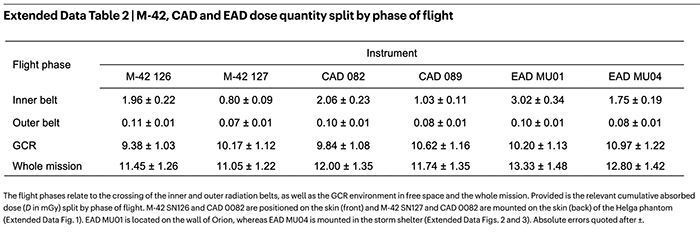
Fig 21. Extended Data Table 2: Effective doses for the various detectors for Helga’s skin reported by S.P. George et al. Note the CAD 0089 is mislabelled as CAD 0082.
All Helga’s organs should be treated as Effective Doses, and it is the sum of the parts that make up the Equivalent (full body) dose. But instead of treating it as such, S.P. George et al. 2024 have apparently taken the Effective dose for a single organ to represent the summation of all the organs!
How the hell did D. Laramore’s presentation and the 2024 report by S.P. George et al. prevail under peer review? How did Nature’s proofreaders and fact-checkers miss such a monumental yet elementary error as favouring the results from one part of the picture instead of looking at the sum of its parts? Is this truly the level to which US education has degenerated?
Where’s the Sun?
Looking at the readouts of Artemis I’s various detectors, specifically B of the S.P. George et al. graph reprinted in Fig 10, and the HERA readouts published by N.N. Stoffle et al. 2023, there is one anomaly that stands out: the graph has one massive peak representing the spacecraft’s passage through the inner Van Allen belt followed by a relatively flat line for the GCR radiations. But there are no additional peaks for the solar flares encountered along the way.
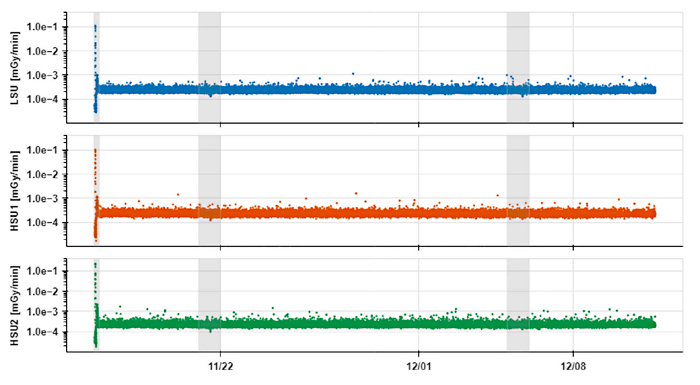 Fig 22. HERA readouts for the entire Artemis I mission as reported by N.N. Stoffle et al. 2023.
S.P. George et al. adamantly deny that any such solar flares took place: "No solar-particle events occurred during the Artemis I mission" Having intently followed the Artemis I mission and monitored the daily reports of solar activity during the flight, I knew this claim was false. Artemis I launched on November 16, 2022. Two days later, on November 18, the Sun released a coronal mass ejection (CME), which was expected to spark bright auroras over the Arctic.29 A second CME struck the Earth on December 7, 2022,30, 31 and a third on December 9.32 The Artemis I splashed down two days later, on December 11, 2024.
Wanting to know about the effects these flares had on the Artemis I radiation detectors, I telephoned into NASA’s Artemis I Post-Flight Update held on March 8, 2023. For the most part, news reporters only asked questions about the Orion’s heatshield, which suffered considerably more damage on re-entry than expected. For these questions the panel usually gave detailed answers lasting several minutes. At about 56 minutes into the media teleconference, I asked my question. Unlike all their previous exchanges with reporters, the reply to mine took less than a minute! The following is a transcript of that exchange:
Jarrah White: There were three Coronal Mass Ejections during the Artemis I mission. One on November 22nd, one other one on December 7th, and the third on December 9th. Such major proton events could pose a serious threat to the astronaut safety, might even kill them, how well did the Artemis I’s shielding hold up against these solar flares, and what were the radiation detector readouts regarding proton flux and energy? Thank you.
Howard Hu, Orion Program Manager: Yeah, I– I'm not as familiar with you as, as those events, uh, well I talked a little about those radiation sensors that we had across the spacecraft so, uh, we do have radiation protection, uh, within the spacecraft of course we're measuring, uh, the radiation we experience on Artemis I, that data will be very important, uh, to inform us, uh, going forward. 33
I cannot overstate how shocked I was to hear this answer. That is the head of the entire Orion program answering my question. The extra heatshield damage would have been an understandable concern. But one would have thought the readouts from solar flare radiation would also have been a priority consideration, worthy of investigation before naming the crew for Artemis II less than one month later. Instead, Howard Hu essentially told me "You know more about those flares than I do!"
I could not find any publications regarding the proton fluences for the events that I cited. But for comparison’s sake, back in Column #5, we calculated that the Class M solar proton event of April 18, 1972 would have delivered 1.32rad (6.6rem) from 10MeV protons and 1.03rad (5.15rem) from 30MeV protons (11.75rem total).34
Looking back to our table, if we add this solar flare dose to the calculated 11day body dose, this means the Apollo 16 crew would have received anywhere between 32.57rem and 55.02rem for their mission. Possibly as high as 151.55rem to 574.05rem if the implications of calculating Helga’s skin dose are to be believed (again, I must emphasize that I remain sceptical about the resulting GCR doses but find confidence in the correlation between Helga’s implied 138rem Van Allen dose and my calculated AP8 proton-neutron dose of ~130rem). All this is still being rather generous, given that these totals ignore the fact that the Artemis has superior shielding to Apollo. Had the Apollo 16 crew flown an Orion spacecraft, we could ignore the 10MeV proton dose and reduce the total to between ~26rem and ~145rem – albeit that’s hardly a figure to celebrate.
Service Module shielding?
While on the subject of the Apollo 16 major solar flare, now might be the perfect opportunity to debunk a demonstrably false myth that has even found its way into S.P. George’s 2024 paper.
Recently, Danny Jones hosted a debate between Bart Sibrel and Apollo 16 LM Pilot Charley Duke. When asked about the dangers of micrometeoroids on the Moon and what steps needed to be taken to avoid them, Duke said he had no recollection of any discussions concerning micrometeoroids but instead offered this additional information regarding what evasive action was planned to be taken against a solar flare:
We had a, if they if they saw a solar flare, the only thing I remember, if we had a solar flare, we would have to get back into the Lunar Module and then lift off and then join up [with the Command Module] and point the heat shield towards the solar flare.35
Fig 23. Astronaut Charley Duke describing NASA’s alleged evasive action against a solar flare.
This idea that Apollo astronauts could just point the heatshield, and by extension the service module, at the Sun and use that additional bulk to shield themselves against a solar flare is a preposterous common misconception that would never work. It falls apart for one simple fact: solar flares are not directional. Particles from such events are carried off in all directions along the Sun’s magnetic field lines which span across the entire solar system. The great solar flare of January 27, 2012, for example was pointed away from both the Earth and Mars. Yet the solar protons it emitted were registered by both the Mars Reconnaissance Orbiter and various near Earth satellites, because the Sun’s magnetic field deflected them towards both planets. 36
If NASA did indeed tell Duke that pointing the Service Module at the Sun was their planned evasive action against a solar flare, it was a lie and they should have known better. They knew such a procedure wouldn’t work as early as 1963. As J.W. Keller et al. had explained:
Contrary to what might be expected, much of the radiation encountered in solar proton outbursts appears to reach the vicinity of the Earth in isotropic distribution, thus necessitating protection from all directions.
Despite being nonsense, the lie that one could point the bulky end of a spacecraft towards the incoming front of solar radiation has been pushed for years. Jim Oberg pushed it on the Zig Zag Productions documentary, The Truth Behind The Moon Landings, Jay Windley had falsely pushed it in online forums and falsely claimed on his website that solar flares are directional.
These lies were taken so seriously that, between at least 2012 and 2016, Elon Musk repeatedly claimed that his proposed manned mission to Mars would require only “a column of water pointed at the Sun.”37,38 After he had twice made a fool of himself: first during his November 2012 lecture at the Royal Astronomical Society in England and again when he unveiled his Interplanetary Transport System at the 2016 International Astronomical Congress, I explained the flaw in his thinking to Elon Musk in several Twitter posts and YouTube videos that had I produced in response.39, 40
Musk never confirmed reception, but it is obvious that he must have seen those videos, because the following year, he revised his spacecraft, (renamed BFR and now currently renamed again as StarShip) to include a “solar storm shelter.” 41 That same year, at the ISS R&D 2017 conference, Musk conceded that his column of water wouldn’t work. In explaining the error of his ways, he literally paraphrased everything I had told him, albeit with some grammatical quirks of his very own:
Something learning a lot about solar winds and fast particles and whatnot. And one of the things I learned recently that I didn’t quite understand is that, I always thought of the particles from the Sun, the solar wind, as going kinda straight out from the Sun. But they, they follow the magnetic field lines. So, you actually can get the particles coming at you from the side, even though it’s a direction orthogonal to the Sun. So, you do need some amount of protection, at least on, kind of, four or five sides.42
Clearly, Elon Musk must have seen my videos! It’s a pity S.P. George et al. 2024 have apparently ignored them. Like solar flares, the radiation in the Van Allen belts is omnidirectional. It comes from all sides. Yet, early in their paper, S.P. George et al. write:
Towards the end of the inner-belt transit, Orion performed a 90° rotation lasting 5 min to execute trans-lunar injection. During this manoeuvre, an unexpected decrease in the dose rate of 50% was observed in comparison with AP9-IRENE26 calculated proton fluxes.
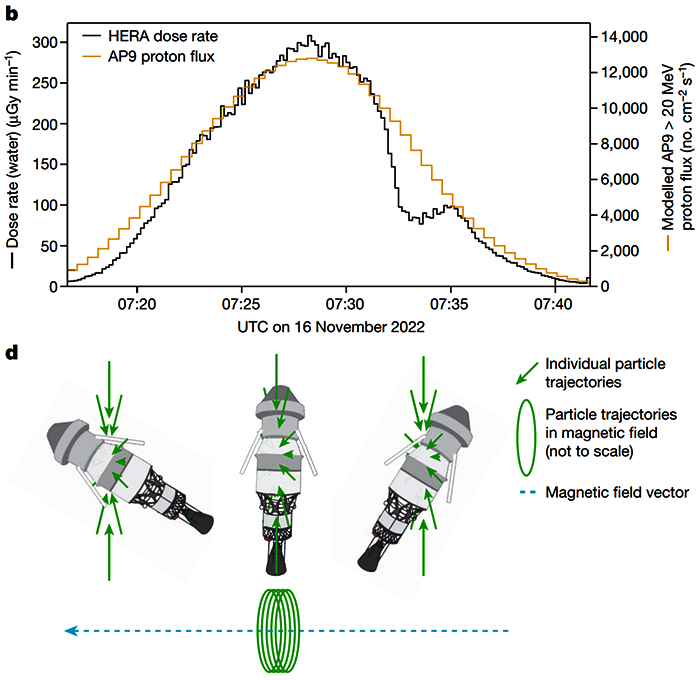
Fig 24. Anomalously drop in measured radiation compared with AP-9 predictions, dubiously attributed to rotating the Artemis I. S.P. George et al. 2024.
S.P. George et al. attribute this mysterious drop in radiation to the Artemis I spacecraft orientating its service module in the direction of the incoming protons. But this makes no sense. Remember, the Van Allen particles are omnidirectional. If the anomalous drop in radiation was due the extra shielding offered by the service module, it wouldn’t be an anomalous drop, the reduction of radiation counts would have been prevalent throughout the entire transit of the belt.
A more logical cause for the drop in radiation is suggested by James Van Allen’s original observations in the late 1950s.
At altitudes of 200 to 300 miles the counting rate was low. When the satellite went out to 500 to 600 miles, the apparent rate ascended rapidly and then dropped almost to zero. […] A sufficiently high level of radiation can jam the counter and send the apparent counting rate to zero. We had discovered an enormously high level of radiation, not a lack of it.18
Although the drop observed by S.P. George et al on Artemis I occurred much higher in altitude than it did on Explorers 1 and 3, the same principle applies. Given the omnidirectional nature of the Van Allen protons, from my chair the more plausible explanation for this drop is that the detectors became overwhelmed by the protons encountered in the heart of the inner belt and – just like Van Allen’s original Geiger counters before them – became jammed and started dropping towards zero. The fact that the spacecraft was reorientating itself at the time of this drop is circumstantial, at best.
Artemis II
Despite the potentially catastrophic damage that the Artemis I heatshield sustained, NASA publicly asserts that they resolved the problem to their satisfaction – by dumping the Skip Re-entry procedure for a loft entry instead! This has terrified former astronaut Charles Camarda, fearful that Artemis II will meet the same fate as Space Shuttle Columbia (or perhaps, more accurately, emulate the fate of Capricorn One, the fictional Apollo style command capsule that burned up after heatshield separation upon returning from Mars).
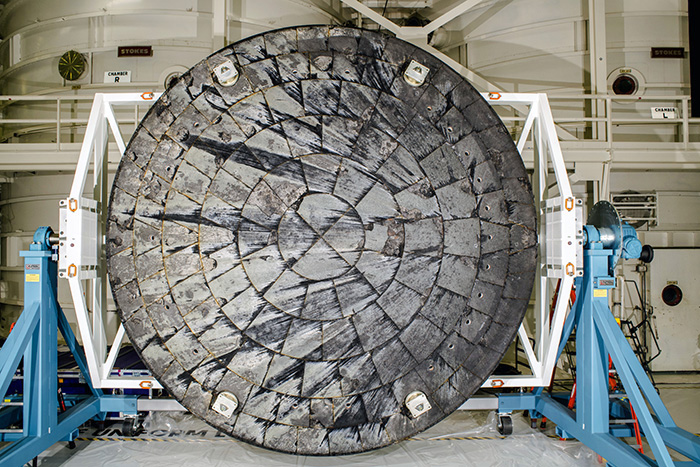
Fig 25. Post-flight photos of Artemis I’s damaged heatshield. NASA.
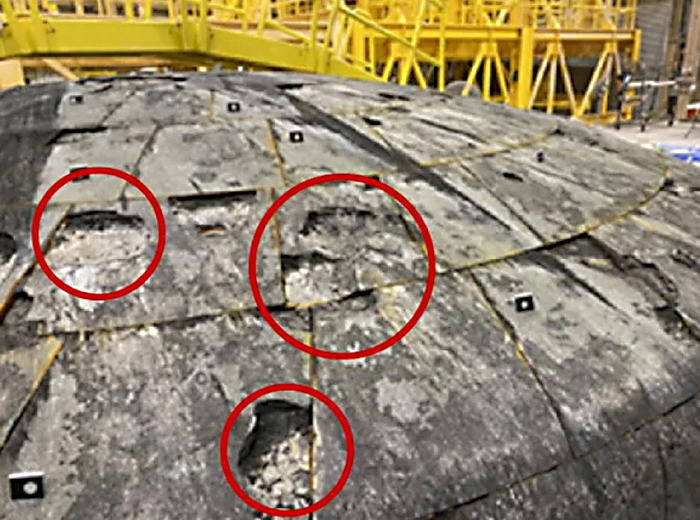
Fig 25a. Close up of the deep holes left by lost material in the shield – yikes! NASA.
I, too, am gravely concerned that NASA is heading for a loss of the crew. In fact, I feel like I am the next Roger Boisjoly screaming into the void and getting ignored, perhaps Camarda feels that way too.43
But honestly, the heatshield is the least of my concerns. At this rate, the crew would most likely be dead or dying before they would ever get the chance to test the loft entry procedure. For decades, propagandists attempting to refute Apollo Moon landing hoax theories have argued that these spacecraft flew rapid trajectories that avoided the most intense regions of the Van Allen belts. The exact opposite seems to be true for Artemis II, which NASA says will be the first crewed lunar mission since Apollo 17. At the time of writing, the mission is scheduled for February 8, 2026 at the earliest, with that launch window ending in April 2026.
On their website, NASA writes the following concerning Artemis II’s initial parking orbits before making translunar injection:
The spacecraft will first reach an initial orbit, flying in the shape of an ellipse, at an altitude of about 115 by 1,400 miles. The orbit will last a little over 90 minutes and will include the first firing of the ICPS to maintain Orion’s path. After the first orbit, the ICPS will raise Orion to a high-Earth orbit. This maneuver will enable the spacecraft to build up enough speed for the eventual push toward the Moon. The second, larger orbit will take approximately 23.5 hours with Orion flying in an ellipse between about 115 and 46,000 miles above Earth.44
The first orbit will place the spacecraft within the heart of the inner Van Allen. As established above (J.W. Keller et al. 1963) that requires 100g/cm2 of shielding to bring the proton dose rates down to ~1rem/hr. Equivalent to about a meter of water. And again, the Orion spacecraft only has about a fifth of the necessary shielding. E.E. Kovalev 1983 reported that for a 30degree inclination orbit typically used by American spacecraft, the dose rates from 200MeV protons alone are nearly 400rem/day.45
Fig 26. Equivalent dose rates from 200MeV protons in the inner Van Allen belt. E.E. Kovalev.
The second orbit for Artemis II is, for all intents and purposes, an enlarged Molniya orbit but without the high inclination. By design, a Molniya orbit takes the spacecraft through the Van Allen belts at least four times a day.46
Twice for the inner belt and twice for the outer belt. Keeping in mind that the Artemis missions are much less inclined to the equator than a Molniya, that, again by design, means exposures to more intense regions of the Van Allen Belts .
Clearly, these proposed parking orbits for Artemis II fly completely in the face of everything that NASA claims the agency did to minimise radiation exposure on Apollo. Is this a new hoax and does NASA seriously think its followers are this stupid? Or are they truly so recklessly cavalier about flight safety?
As if to suggest the latter, in a recent National Geographic article, Lisa Carnell, the director for NASA’s Biological and Physical Sciences Division, was quoted as saying,
Artemis II will allow us to get some of the first human biological data from deep space radiation. It’s the first time you can get data on healthy individuals and really understand what's happening in a radiation environment.47
Apparently, all those alleged circumlunar flights of the Apollo 8, 10 and 13 missions did not provide them with any useful data!
If this mission is yet another overhyped tin can, destined to be kicked further and further down the road until its inevitable cancellation, all will be well, as NASA nearly says. As it stands, we have the engineering problems with the spacecraft itself, the recent emergency return of astronauts from the ISS in January 2026, the continuing media coverage, instigated by NASA on the dangers of radiation for astronauts, and even as Artemis II is rolled out to the launch pad, the very public reservations relative to the actual efficacy of that insufficient heatshield.48
All these factors combined give every indication that there will be a retraction from this flight – at least in the early part of 2026. But if not, and by some miracle NASA does manage to launch a crewed Artemis II, it is my opinion that whenever that might be, these proposed parking orbits virtually guarantee a disastrous outcome for the crew.
Jarrah White
Aulis Online, January 2026
About the Author
Jarrah White is an Australian filmmaker, astrophysicist and geologist. He has Certificate III & IV qualifications with distinctions in Screen and Media at the Sydney Institute of TAFE NSW, Australia; and a BSc with a Major in Geology and a Minor in Astrophysics completed in November 2017 and July 2019 respectively at Macquarie University.
Additional editing and input Mary Bennett
Dedicated to Marcus Allen
![]()
This article is licensed under
a Creative Commons License
AULIS Online – Different Thinking